
An agent spends 300 minutes handling calls during a 480-minute paid shift. Is their occupancy 62.5% or 83.3%? You need one more number: how much of the remaining time they were ready to receive calls.
Call center occupancy is the share of available queue time spent handling contacts. For a voice queue, the calculation used here is handling time divided by handling plus ready time. Training, breaks, and other off-queue activities need separate state labels before you can trust the result.
This guide uses a synthetic shift ledger you can download and reconcile. It shows why occupancy and utilization can both be correct at different percentages, how to combine intervals, and what to investigate before changing a schedule.
Define the time states before calculating occupancy
For this voice example, handling time includes talk, customer hold, and after-call work, or ACW. Ready time is the time an agent is available for another call but isn't handling one. The calculation is:
Occupancy = handling time ÷ (handling time + ready time) × 100.
Don't substitute all logged-in time without checking your platform's state definitions. Someone may stay logged in during training or a break. Counting those minutes as available makes a busy queue appear quieter than it was.
| State | In the handling numerator? | In available queue time? | Record separately? |
|---|---|---|---|
| Talk | Yes | Yes | Yes |
| Customer hold | Yes, under this policy | Yes | Yes |
| After-call work | Yes | Yes | Yes |
| Ready and waiting | No | Yes | Yes |
| Training away from the queue | No | No | Yes |
| Paid break away from the queue | No | No | Yes |
Decide how ringing, consultation, transfers, and system outages map to those states. The table is a declared measurement policy, not a claim that every platform uses the same labels. If two systems classify a state differently, document the mapping before comparing their agent occupancy reports.
Average handle time, or AHT, is related but has a different denominator: handling time per handled contact. AHT can help explain an occupancy change, but it doesn't tell you how much ready time the team had.
Reconcile occupancy, utilization, and shrinkage
The distinction in call center occupancy vs utilization is the time base. Occupancy asks how busy the available queue time was. Utilization asks how a larger paid or scheduled time budget was used. Shrinkage describes time unavailable for the activity you are planning. Define each numerator and denominator explicitly.
Here is one synthetic eight-hour shift. All 480 minutes are paid for this example, including the breaks. The ledger doesn't include an unpaid meal period.
| Activity | Minutes |
|---|---|
| Talk | 230 |
| Customer hold | 20 |
| After-call work | 50 |
| Ready and waiting | 60 |
| Training away from the queue | 30 |
| Paid breaks | 90 |
| Total paid shift | 480 |
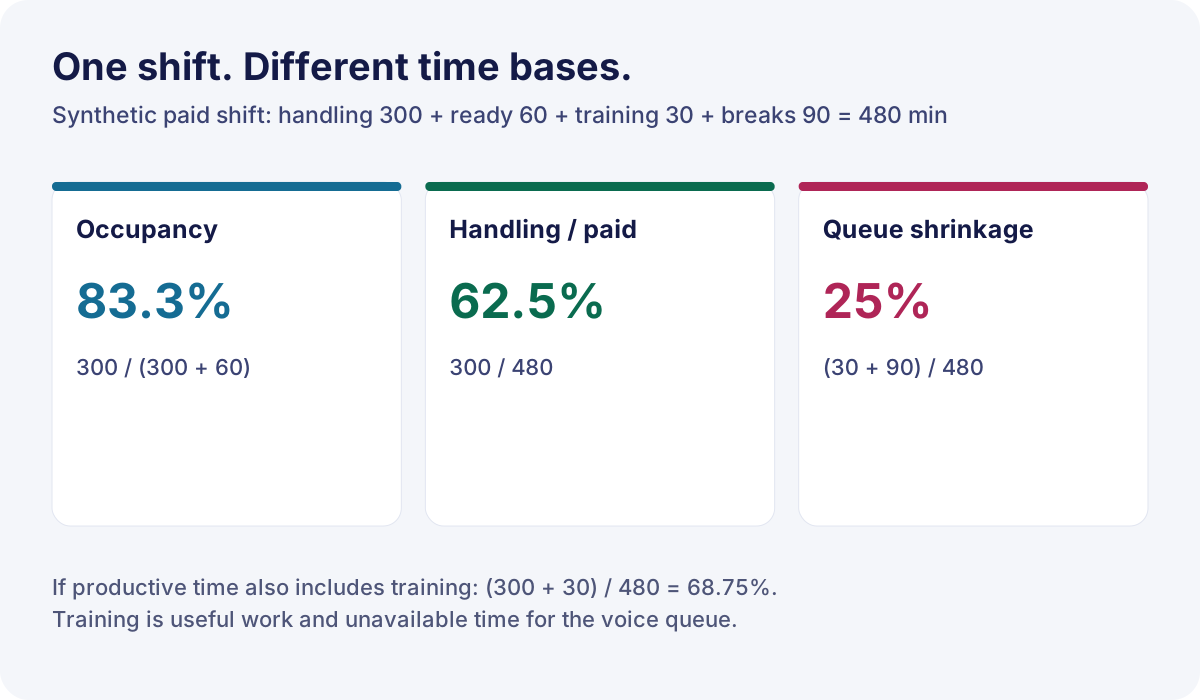
Handling is 230 + 20 + 50 = 300 minutes. Available queue time is 300 + 60 = 360 minutes. The call center occupancy rate is therefore 300 ÷ 360 = 83.3%, rounded.
If your utilization definition is handling time divided by paid time, it is 300 ÷ 480 = 62.5%. If your productive-time definition also includes training, that measure is (300 + 30) ÷ 480 = 68.75%. Use different labels so readers know which activities count.
Queue shrinkage is (30 + 90) ÷ 480 = 25% under this policy. Training can be useful paid work and still be unavailable time for a voice queue. Those two descriptions don't conflict.
Keep the staffing conversion consistent
If a plan needs ten people available for the queue and you assume 25% shrinkage across the scheduled pool, the simple capacity conversion is 10 ÷ (1 − 0.25) = 13.33 scheduled equivalents. Adding 25% to ten produces 12.5, which doesn't recover ten available equivalents after that loss.
This arithmetic checks the time budget. It doesn't produce an executable roster: breaks, skills, part-time shifts, and interval coverage still need scheduling. A small queue may require different coverage decisions from a large pooled team even when their daily averages look similar.
Keep absence in the planning model as well. An employee absent for the whole shift may have no login record, so their lost scheduled time won't appear in a report built only from agent-state events. Reconcile the schedule with attendance before estimating shrinkage for future staffing.
Aggregate intervals without double counting
Download the occupancy state ledger. It supplies one synthetic agent's complete shift, with start and end timestamps and expected handling and ready minutes. Use it to test your spreadsheet or reporting query before importing live records.
For the provided columns, handling minutes are in F and ready minutes in G. The Excel calculation is =SUM(F2:F11)/(SUM(F2:F11)+SUM(G2:G11)). Format it as a percentage. The result is 83.3%, subject to rounding.
The rows use non-overlapping intervals: each state begins when the previous state ends. A row ending at 10:00 contributes time up to 10:00; the next row begins there. That convention prevents counting the boundary twice.
Run these checks before calculating
- Sort the events by agent and start time. Check for duplicate rows and overlapping states.
- Compare the end of each event with the start of the next. Keep unexplained gaps as unknown time until reconciled.
- Split events at reporting boundaries. A handling state from 09:20 to 09:40 contributes 10 minutes to each of two adjacent half-hour intervals.
- Sum handling and ready seconds across the chosen group. Divide those totals once.
- Compare covered time with the expected shift. A complete synthetic ledger totals 480 minutes; a real ledger needs its own scheduled boundaries and documented exclusions.
When a state is missing, don't automatically call it ready time. The agent could have been handling work, disconnected, or off-queue. Show how much unknown time remains and whether the report can be finalized under your reconciliation policy.
Weight by time rather than agent percentages
Suppose agent A has 90 handling minutes and ten ready minutes: 90% occupancy. Agent B has ten handling minutes and ten ready minutes: 50%. The combined result is 100 ÷ 120 = 83.3%, not the 70% obtained by averaging their percentages.
The same rule applies across intervals and days. Weighting matters when agents work different shifts, join the queue for different lengths of time, or cover different skill groups. Keep the handling and ready totals in the report so another person can reproduce the combined rate.
If an interval has no handling and no ready time, occupancy is undefined. Report it as not applicable, together with the reason. Turning it into zero would suggest unused available capacity; turning it into 100% would suggest everyone was fully occupied. Neither description follows from an empty denominator.
Treat concurrent chat separately
Two chats open for the same 20 minutes produce 40 session-minutes but only 20 minutes of elapsed time. Adding both session durations to a voice-style numerator can produce a rate above 100%.
Choose a channel-specific measure: elapsed time with at least one active conversation, or occupied conversation slots divided by available slots. State the concurrency limit and whether waiting-for-customer time counts. Don't combine those measures with voice occupancy and label the mixture a single agent occupancy rate.
Shared ready time also needs care. If one agent can take work from several queues, the same ten ready minutes cannot become 10 minutes of independent capacity in every queue and then be summed. Report the pooled skill group's occupancy, or disclose a consistent allocation method for queue-level analysis.
Choose a target using service and workload evidence
A useful target is one your queue can sustain while meeting its service and quality requirements. A single percentage cannot establish that. Review occupancy beside waiting time, abandonment, resolution quality, and how long agents remain continuously busy.
Brown and colleagues analyzed call arrivals, customer patience, and service durations separately in their 2005 study of a year's records from an Israeli bank. Those inputs help explain why similar occupancy percentages can accompany different waiting experiences. The historical study isn't a source for a universal modern occupancy target.
What counts as a good occupancy rate therefore depends on the queue, its size, arrival pattern, skills, and service promise. An 80/20 rule describes a service level target, meaning a share of calls answered within a waiting threshold. It isn't an occupancy rule.
What to check when the rate is low
A 30% reading deserves investigation, but it doesn't establish that 70% of the team is unnecessary. First check whether training or outages were mislabeled as ready, whether demand was assigned to another queue, and whether the available agents had the required skills.
Then review the coverage requirement. A low-volume language line may need a person available even when calls are sparse. Compare that commitment with pooling or overflow options before removing coverage. If the work can be shared, confirm that the backup team can actually complete it.
What to check when the rate stays high
Look at consecutive intervals, missed breaks, long after-call work, repeat contacts, and quality reviews. Ask agents which tasks leave them unable to recover between contacts. Daily averaging can conceal several difficult hours even when the final percentage looks ordinary.
In a NIOSH evaluation conducted in January 2013, 38 employees at one New York telephone call center returned surveys. Workload and inadequate breaks appeared among reported stressors. That small, site-specific assessment supports asking about working conditions; it doesn't establish a safe occupancy cutoff or prove that a given percentage causes burnout.
| Observed pattern | Next evidence to inspect | Action to test |
|---|---|---|
| High occupancy and rising waits | Arrivals, handle time, effective staffing | Adjust coverage or remove the cause of longer handling |
| Low occupancy with a waiting queue | Skills, routing, availability labels | Correct eligibility or state mapping |
| Stable occupancy but weaker resolution | Contact reasons and quality samples | Improve training or the process agents must follow |
| Daily average looks fine, long busy runs remain | Interval sequence and break records | Rebalance breaks and coverage across the day |
Use workforce management planning to connect those findings to a schedule. Trace a change in occupancy to the time states, arrivals, or staffing that produced it.
Use the same ledger with an outsourced team
Before comparing an internal team with an outsourced team, exchange the state dictionary, time zone, reporting interval, and paid-time definition. Ask both teams to calculate the same sample and explain any difference. Include unknown time and exclusions in that exercise.
For a customer support engagement with Callnovo, the ledger can serve as a reporting brief: which queues are in scope, which activities count as handling, who owns the state mapping, and who resolves an unexplained gap. Agree the operating target alongside the service requirement and workload evidence.
Also name the person who approves a mapping change. Moving training into a different state code can alter utilization and shrinkage reports without changing the work. Keep a dated version of the mapping and annotate the trend when its definition changes.
These checks complement your broader call center performance metrics. They help a review distinguish a measurement change from a staffing or service change before either team acts on the headline percentage.
References
- Brown et al., Journal of the American Statistical Association. 2005. Analysis of a full year of bank call-center records.
- CDC/NIOSH. 2013. Evaluation of Job Stress and Work-Related Health Concerns at a Telephone Call Center.
Review the interval before changing the schedule
- Does available time mean handling plus genuinely ready time? If training, breaks, or unknown gaps are included without explanation, repair the state mapping first.
- Can someone reproduce the group result from handling and ready totals? If the report averages individual percentages, recalculate it with time weights.
- What happened to waiting, resolution, and sustained workload? If those deteriorated while occupancy improved, investigate the intervals and processes behind the change.
Use call center occupancy to locate where available time went. Keep the service promise, the state ledger, and the people doing the work in the same review.