

Your operations report says 70%. Your supplier's report says 77.8%. Both teams are looking at the same ten calls. Before discussing staffing, check whether one report removed a short abandoned call from its denominator.
Call center service level measures the share of eligible calls answered within a specified waiting time. You can use it to review access to your team, but only after agreeing on what counts as a call, when waiting begins, and how abandoned calls are treated.
The worked example below gives you ten synthetic call records, three calculations, and a measurement clause you can adapt for a supplier review. The records are teaching data, with deliberately awkward boundaries you can test against your own reporting system.
What call center service level actually measures
An 80/20 target means answering 80% of the eligible calls within 20 seconds. A 95% service level is incomplete without the waiting threshold, reporting period, queue, and denominator. Answering 95% within 20 seconds and answering 95% within two minutes describe different access conditions.
For this guide, the answer event is a connection to a human agent. If your dashboard measures an IVR response or an AI answer instead, label that separately. Otherwise, replacing a greeting could appear to improve access even though callers wait just as long for a person.
Service level is one metric inside a service level agreement, or SLA. The agreement also needs the measurement rules, reporting responsibilities, review process, and any negotiated remedies. Record those terms alongside the metric definition.
Keep other inbound call center metrics alongside it. Average speed to answer describes an average wait among the calls included in that measure. Abandonment rate counts callers leaving before answer. First-contact resolution asks whether the issue was resolved on the first contact. Customer satisfaction measures a different part of the experience again. Faster pickup alone doesn't establish any of those outcomes.
Set the clock and denominator before using a formula
Start with a named queue and a precise interval. Our example uses calls entering the support queue from 09:00:00 up to, but excluding, 09:30:00 UTC. Waiting starts at queue entry. A wait of exactly 20.000 seconds qualifies; 20.001 seconds doesn't.
The basic calculation is:
Service level = calls answered within the threshold ÷ eligible offered calls × 100.
“Eligible” needs a written definition. Three reports can use the same numerator while answering different questions:
| Denominator policy | What remains in the denominator | What changes |
|---|---|---|
| All offered calls | Answered and abandoned calls entering this queue | Abandonment remains visible in the access measure |
| Exclude short abandons | All offered calls except abandons below an agreed cutoff | Removing those calls raises the percentage without changing answer speed |
| Answered calls only | Only calls eventually answered | This measures timely answers among answered calls; it hides abandoned callers from the denominator |
Use the last calculation only with its full label. It isn't interchangeable with service level across all offered calls. If your contract excludes short abandons, report their count next to the adjusted result so both parties can see the effect.
Decide how exceptional events enter the report
A transferred call can create a new queue entry. For a queue-level report, use a unique queue-entry identifier and count each eligible entry once. For an end-to-end customer journey, keep a separate journey identifier. Summing queue entries across teams and calling the result “unique callers” will overcount transfers.
A callback request also needs its own rule. Record the original caller's exit and measure whether the promised callback happened on time. Don't silently classify the caller as answered when they select the callback option.
Calls crossing an interval boundary need time to finish. Under our arrival-based rule, a call entering at 09:29:50 and answered at 09:30:05 belongs to the earlier interval. Its wait is 15 seconds. A live dashboard at 09:30:00 must mark that cohort provisional; a later report can finalize it after the outcome arrives.
Missing timestamps, duplicate events, and negative waits go into an exception list. Dropping them quietly makes the report difficult to reconcile. If a required record is unresolved, show the affected count and keep the result provisional according to your agreed policy.
Reconcile the formula against individual call events
Download the service level event ledger. It contains timestamps and expected classifications for ten synthetic calls. The short-abandon cutoff is strictly less than five seconds, and the answer threshold is at most 20 seconds.
| Records | Final outcome | Count | Within 20 seconds? |
|---|---|---|---|
| C01–C06 | Answered after 4, 8, 12, 16, 19, and 20 seconds | 6 | Yes |
| C07 | Answered after 20.001 seconds | 1 | No |
| C08 | Abandoned after four seconds | 1 | No; short abandon |
| C09 | Abandoned after 25 seconds | 1 | No; other abandon |
| C10 | Entered at 09:29:50, answered at 09:30:05 | 1 | Yes; belongs to the arrival interval |
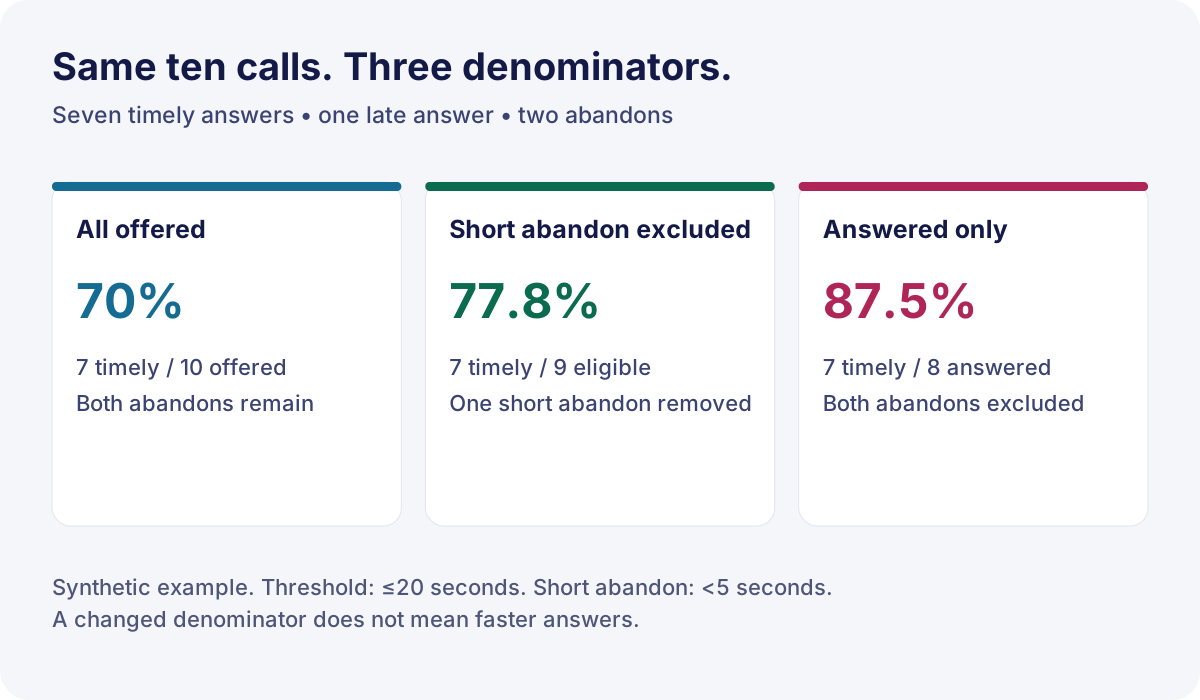
There are seven timely answers, eight answered calls, two abandoned calls, and ten total offered calls. The same events produce:
- All offered: 7 ÷ 10 = 70%.
- Excluding the one short abandon: 7 ÷ 9 = 77.8%, rounded.
- Answered calls only: 7 ÷ 8 = 87.5%.
Reproduce it in a spreadsheet
The CSV includes wait_ms, timely, short_abandon, and answered fields. Milliseconds avoid rounding a 20.001-second wait down to 20 before classifying it. The expected flags are there to compare with your own calculation; don't treat imported flags as the source of truth.
For rows 2–11, with timely flags in column G, short-abandon flags in H, and answered flags in I, use these Excel formulas and format the results as percentages:
- All offered:
=SUM(G2:G11)/COUNTA(A2:A11) - Excluding short abandons:
=SUM(G2:G11)/(COUNTA(A2:A11)-SUM(H2:H11)) - Answered only:
=SUM(G2:G11)/SUM(I2:I11)
Validate the row IDs first: duplicate IDs would make COUNTA the wrong denominator. On a real export, check that each queue entry has one final outcome, an exit after entry, and enough timestamp precision to apply your threshold. Retain the original export and the mapping version used to produce the report.
Now change one test input. Move C08's exit from four seconds to exactly five seconds. Under the stated rule, it stops being a short abandon, so the adjusted denominator returns to ten and that result falls to 70%. No agent has answered a call any slower. This is why the cutoff belongs in the measurement agreement.
Compare reporting intervals and targets fairly
Add counts before calculating a daily service level. Suppose one interval has seven timely answers from ten eligible calls, while another has 18 from 20. The combined result is 25 ÷ 30 = 83.3%. Averaging 70% and 90% gives 80%, which assigns equal weight to intervals with different call volumes.
Keep interval service levels beside the aggregate. A good daily percentage can conceal a difficult morning. You can also report the share of intervals that met the target, but that is an interval-attainment measure with its own denominator. Specify whether zero-volume intervals are excluded. A zero denominator is not a 100% success.
Compare both parts of the target
90/30 isn't automatically stricter than 80/20. It requires a larger share answered, but allows a longer wait. A queue could satisfy one and miss the other. To compare targets, calculate both from the same wait-time records and look at the calls between 20 and 30 seconds.
Avoid rounding until the final presentation step. Keep the numerator and denominator in the export even when the dashboard displays one decimal place. For small queues, a single late answer can move the rate sharply; include the call count so readers can judge how much evidence the percentage represents.
Investigate missed targets before adding seats
Start with the interval that missed the target. Compare actual arrivals with the forecast, average handle time with its recent range, and scheduled coverage with the people actually available. Then inspect routing: an idle agent in the wrong language group can't necessarily serve the waiting callers.
Brown and colleagues' 2005 study analyzed a full year of records from an Israeli bank's call center. It separated arrivals, customer patience, and service duration as distinct inputs to queue analysis. That structure is useful for diagnosis; the historical sample doesn't supply a current target for your queue.
| What changed in the missed interval? | Check next | Possible response to test |
|---|---|---|
| Arrivals exceeded forecast | Campaign, outage, repeat contacts, time-zone mapping | Update the interval forecast and coverage |
| Handle time increased | Reason mix, hold time, after-call work, system delays | Address the process causing the extra work |
| Scheduled seats weren't available | Breaks, training, absence, login or routing states | Reconcile staffing and state records |
| Correct skills were unavailable | Eligibility and overflow rules | Add a qualified fallback or change coverage |
Call center occupancy helps describe the load on available agents, while workforce management planning connects that load to scheduling. Neither replaces the arrival and waiting-time evidence.
If you use Erlang C, check its assumptions, including the absence of abandonment and its simplified arrival and service-time model. In a 2019 simulation study, Thomas Robbins found that Erlang A and C had different biases and neither dominated in every tested condition. The study examined steady-state scenarios with sufficient capacity, not an arbitrary live overload. Use modeling to test a staffing scenario, then compare its predictions with your actual intervals.
Put the measurement rules in an SLA
A call center SLA should let your team and the supplier reproduce the same result independently. The following is a measurement example to adapt; choose the target and business terms for your own service.
For the English support queue, measure calls entering each 30-minute interval using UTC timestamps. Count a call as timely when a human agent answers within 20.000 seconds of queue entry. Include abandoned calls in offered volume. Attribute cross-boundary calls to their queue-entry interval and finalize the report after terminal events are available. Report timely, late, abandoned, and unresolved counts separately. Compute period totals from counts. The nominated reporting owners reconcile exceptions before treating a provisional result as final.
Add a target, business hours, reporting deadline, source system, and named owners. If the supplier's native report uses a different definition, retain both labels and attach a reconciliation. Agree how planned maintenance, transfers, callback selection, and missing events are handled before reviewing performance against the target.
When discussing customer service outsourcing with Callnovo, bring a sample queue export and the measurement rules you currently use. Those records make the scope of a reporting discussion concrete: which calls belong to the team, which skills must be staffed, and what happens outside coverage hours. The same checklist works when you compare another supplier.
Version the agreement when the queue or reporting configuration changes. Keep the effective date next to the metric definition so a trend spanning two versions doesn't look like a clean before-and-after performance comparison.
References
- Brown et al., Journal of the American Statistical Association. 2005. Analysis of a full year of bank call-center records.
- Thomas R. Robbins, East Carolina University. 2019. A steady-state simulation comparison of Erlang A and Erlang C.
Check three things before your next review
- Can both reporting owners recreate the percentage from the same event rows? If they can't, resolve the denominator, clock, and exceptions before judging the team.
- Can you see the missed intervals and their call counts? If only the monthly percentage is available, ask for the interval view before changing coverage.
- Does the proposed target have evidence from your callers, queue, and staffing model? If it comes only from a generic 80/20 rule, test it against your own waiting and abandonment data.
That gives your call center service level review a concrete starting point: an agreed set of calls, a reproducible calculation, and a specific operational question to investigate.